 Forward Future
The Index Fell 1.2% — But 335 Stocks Rose: S&P 500 Breadth Just Hit Its Best Level Since August
2026-10-24
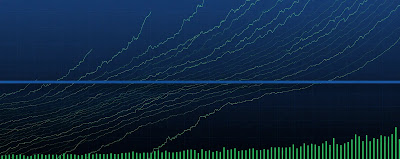
The Index Fell 1.2% — But 335 Stocks Rose
The S&P 500's market breadth just hit its best level since mid-August: 61% of S&P 500 stocks are now trading above their 50-day moving average, even though the index itself has been nearly flat for three weeks. That split — a flat headline index hiding a fast-improving market underneath — is why a post from The Kobeissi Letter on X spread quickly this weekend and was picked up across finance sites.
If you only watched the index this week, you saw a rough finish: the S&P 500 fell 1.2% on Thursday, October 22 and closed Friday lower again. Underneath that, hundreds of individual stocks were quietly moving higher. Breadth measures exactly that participation, and right now participation is expanding at one of the fastest rates in years.
What Happened
On Friday, October 23, the share of S&P 500 stocks above their 50-day moving average rose 5 percentage points to 61%, its highest reading since mid-August. The figure is more than double its level at the October 1 intraday low.
The longer-term picture improved at the same time. The share of stocks above their 200-day moving average rose 3 percentage points to 57%, its highest since September 9. That 200-day measure has climbed 17 percentage points in just three weeks, while the S&P 500 itself remained nearly flat over the same span.
Put together, the speed of the improvement ranked among the three largest breadth gains of the past three years, according to the data shared by The Kobeissi Letter and reported by multiple outlets.
Why It's Blowing Up
The clearest example came on Thursday, October 22. The S&P 500 fell 1.2% that day — yet 335 of its stocks closed higher. In other words, two out of every three companies in the index rose on a day the index dropped sharply. That happens when a small number of very large stocks fall hard enough to drag the capitalization-weighted index down, even as most companies advance.
That divergence is why traders are sharing the chart this weekend. For weeks, the dominant worry has been concentration: a handful of giant technology and AI stocks carrying the index while everything else lagged. A breadth surge in the opposite direction — more stocks joining, fewer stocks left behind — directly challenges that narrative, and it arrived in the same week the market was digesting a 652-point Dow drop, oil above $116 a barrel, and a Federal Reserve decision due on Wednesday, October 28.
Breadth is also a simple, visual story. One number, 61%, tells readers whether a market move is broad or narrow, which is why the post traveled fast on social media before traditional outlets summarized it.
Key Facts
- 61% of S&P 500 stocks traded above their 50-day moving average on October 23 — up 5 percentage points, the highest since mid-August, and more than double the October 1 intraday low.
- 57% traded above their 200-day moving average — up 3 percentage points, the highest since September 9, and up 17 percentage points in three weeks.
- The breadth improvement ranked among the three largest of the past three years, even as the index itself was nearly flat over that three-week span.
- On October 22, the index fell 1.2% while 335 individual S&P 500 stocks closed higher — a textbook breadth divergence driven by heavyweight stocks.
- Context: The S&P 500 closed Friday, October 23 at 7,623.68, down 0.52% on the day, with the Fed's October 27–28 meeting now the next major catalyst.
What Breadth Actually Tells You — and What It Doesn't
A moving average is simply a stock's average closing price over the past 50 or 200 trading days. When a stock trades above that line, its short-term or long-term trend is generally pointing up. When 61% of stocks clear the 50-day line, more companies are in uptrends than downtrends — a broader base than an index level alone reveals.
What breadth does not do is guarantee the index rises next. Breadth improved while the index was flat, which can resolve in either direction: the improving stocks can pull the index up, or the heavyweight laggards can eventually pull the rest down. It also says nothing about valuation, earnings, oil prices, or what the Fed does on Wednesday. It is one health check on participation, not a forecast, and this post is not financial advice.
What's Next
The test comes immediately. Big Tech earnings from Alphabet, Microsoft and Amazon, plus the Fed decision on October 28, will hit exactly the heavyweight stocks that caused the divergence. If those names stabilize while breadth holds above 60%, the “healthier underneath” story gains support. If breadth rolls back below 50% while the index falls, the weekend optimism will look like a head fake. Either way, watch participation, not just the headline number.
Sources
- TokenPost — S&P 500 Breadth Improves as 61% of Stocks Top 50-Day Average (Oct 25, 2026)
- Wisevoter — S&P 500 Market Breadth Shows Broad Gains (Oct 25, 2026)
- KuCoin / Odaily — S&P 500 stocks above the 50-day moving average rise to 61% (Oct 25, 2026, citing The Kobeissi Letter)
FAQ
What is S&P 500 market breadth?
Market breadth measures how many stocks in an index are participating in a move — for example, the percentage trading above their 50-day or 200-day moving average — rather than just whether the index itself rose or fell.
What happened to S&P 500 breadth on October 23, 2026?
The share above the 50-day average jumped 5 percentage points to 61%, its highest since mid-August, while the share above the 200-day average rose to 57%, its highest since September 9.
How could 335 stocks rise on a day the S&P 500 fell 1.2%?
The S&P 500 is weighted by market value, so sharp falls in a few very large stocks can pull the whole index down even when most individual companies close higher, as happened on October 22.
Does improving breadth mean stocks will rise next week?
No. Improving breadth shows broader participation, which many traders view as a healthier market structure, but it does not predict prices — earnings and the October 28 Fed decision remain the next major catalysts.